This article contains affiliate links. As an Amazon Associate I earn from qualifying purchases.
There is a well-known computer simulation of “The Big One”, the large earthquake that could one day strike the San Andreas Fault in California. A magnitude 7.8 rupture begins near the Salton Sea, and the seismic waves race northwest into the city of Los Angeles. In that simulation, the ground beneath downtown keeps shaking like jelly for minutes, even though the epicentre is more than 200 kilometres away.
The reason is underfoot. Los Angeles is built on a basin filled with soft sediment. Those soft layers amplify seismic waves and stretch out the shaking. This has been known for a long time, and it is exactly why downtown keeps shaking in the simulation above.
What has been surprisingly poorly known is the shape of the basin itself. Most earlier surveys of the basin floor, the boundary between the soft sediment and the hard bedrock beneath it, used seismometers laid out in a single line, producing one cross-section at a time. Nobody had a map of the basin as a three-dimensional object. Valeria Villa, a graduate student at the California Institute of Technology (Caltech), and Robert Clayton, professor of geophysics, emeritus, have now made the first one. Their paper was published in the Journal of Geophysical Research: Solid Earth on 4 August 2026.
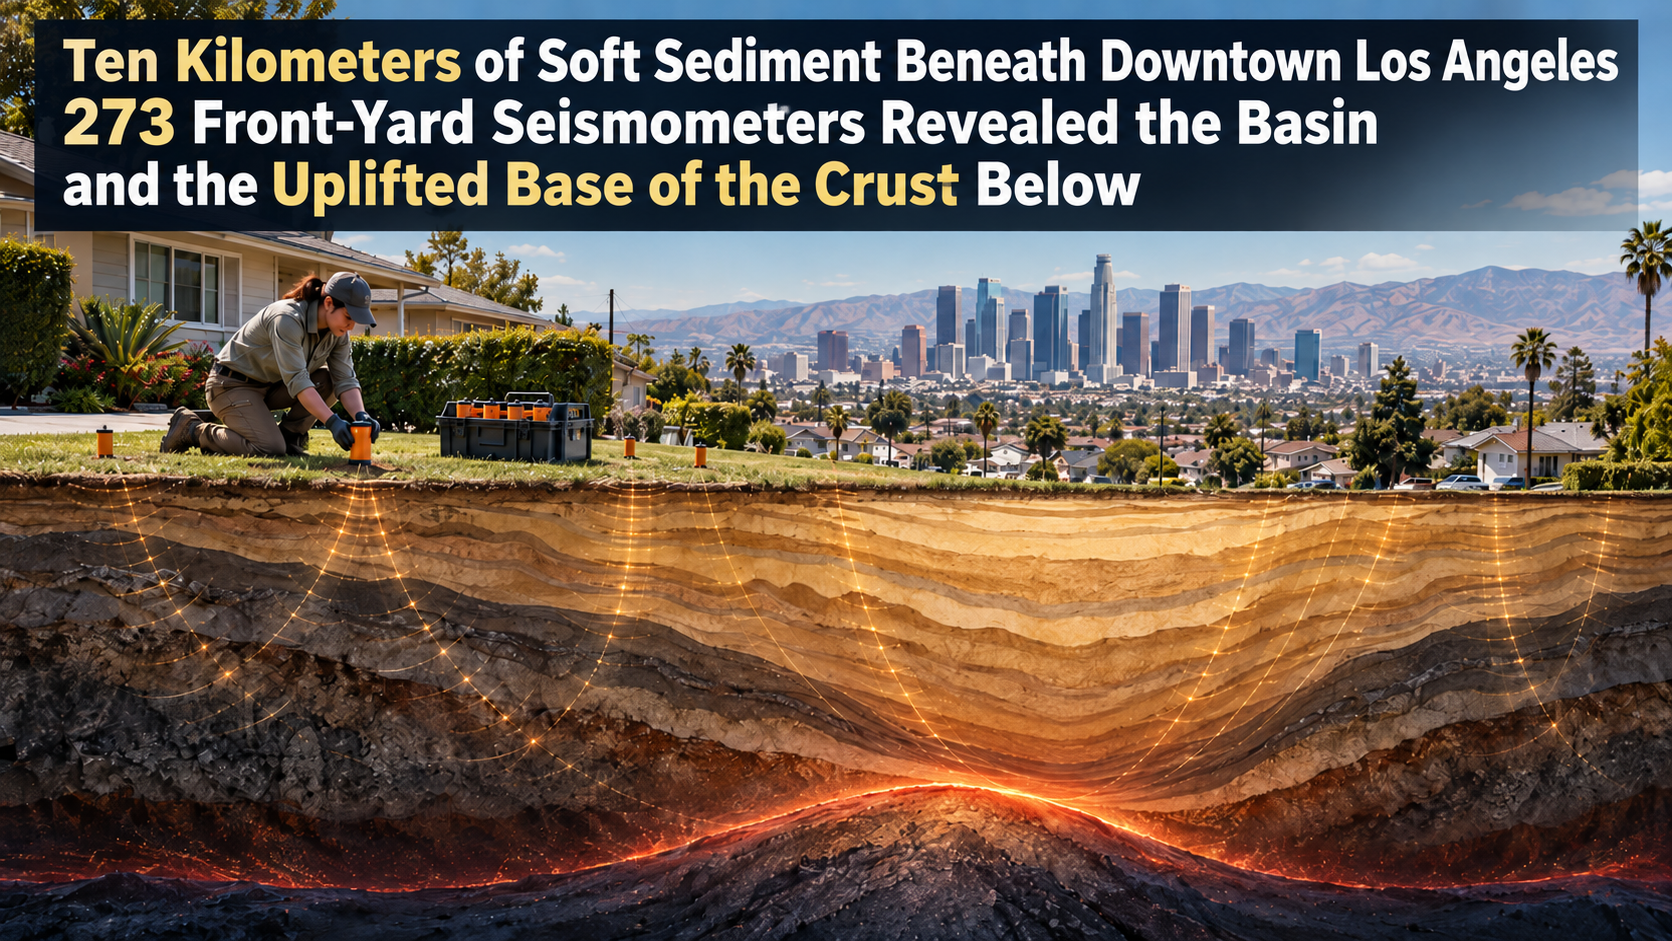
273 Seismometers in Residential Front Yards
In the autumn of 2022, the Caltech team installed 273 small seismic sensors, known as nodes, across the Los Angeles area at intervals of one to two kilometres. The network stretched from Pasadena in the north to Long Beach in the south, and from Santa Monica in the west to Orange County in the east. Each sensor is a small device that pokes about 13 centimetres out of the ground, and the installers were volunteers: Villa and other Caltech graduate students and postdocs. Residential neighbourhoods often turned out to be the best places for them, so the teams asked homeowners and renters for permission to put sensors in their yards. The deployment lasted a month.
What these sensors record is not Los Angeles earthquakes. They pick up the faint waves of distant quakes, far too weak for anyone to feel. When a P wave (the first-arriving compressional wave) from a distant earthquake passes through the boundary between soft sediment and hard rock, part of it converts into an S wave (a shear wave). Measuring how late that converted wave reaches the surface tells you how deep the boundary is. The technique, called the receiver function method, is a standard tool for probing the structure of the crust. The team picked out converted waves not only from the sediment-bedrock boundary but also from layer boundaries within the sediment and from the Moho, the boundary between the crust and the mantle, all in the same records.
The trouble is that in the Los Angeles Basin, the standard method does not work as it stands. This deployment consisted of two straight lines of sensors plus the rest scattered across a wide area. Scattered sensors are far apart, so you cannot confirm which arrival is which boundary by comparing neighbouring records. And the basin itself scrambles the waves. As Villa puts it, the problem was never a lack of seismic waves; it was that the basin garbles the signal.
So the team turned to gravity. Soft sediment is lighter than hard rock, so the thicker the sediment, the slightly weaker the gravity measured at the surface. Combining the gravity data with the seismic records makes it possible to pick out the converted wave from the base of the sediment consistently across the scattered sensors. With this method, which Villa developed, the team turned isolated points into a surface and produced a three-dimensional map of the basin.

Ten Kilometres Under Downtown, One to Four at the Edges
The map revealed a narrow, oblong basin. The deepest point is in the middle, directly beneath downtown, where the soft sediment reaches close to 10 kilometres thick. The rim of the basin is thin by comparison, with only one to four kilometres of sediment above the hard crystalline bedrock. The San Gabriel Valley east of Pasadena and the San Bernardino Valley farther east turned out to sit on much shallower sediment than the Los Angeles Basin.
The basin has been filling with sediment for at least 15 million years. It began underwater, so the lowest layers are marine deposits. Later, tectonic forces lifted it onto dry land, and sediment washed down from the surrounding mountains piled on top. Its distorted shape reflects the faulting, stretching and squeezing of the crust over that time. When the team presented the work at a 2024 conference, they described the outline as relatively flat on the southern side, strongly curved on the northern side, sharply offset on the eastern side, and gently sloping on the western side.
That downtown sits on the deepest part is not news in itself. The value of this study is that the outline of the basin, edges included, is now known in far more detail than before. Elizabeth Cochran, a seismologist at the U.S. Geological Survey (USGS) who was not involved in the study, told Live Science that knowing the shape of the basin edges matters a great deal. Irregular edges can focus seismic waves or steer them in new directions. In the magnitude 6.7 Northridge earthquake of 1994, Santa Monica suffered more shaking damage than expected, and the way the waves travelled along the edge of the basin is thought to be the reason.
The Base of the Crust Rises Under the Basin
There is a second highlight in this study. The sensor records also contained converted waves from far below the sediment, from the Moho, the boundary between the crust and the mantle. When the team examined its depth, they found that the Moho rises beneath the basin compared with the surrounding area. The base of the crust bulges upward in the shape of an upside-down basin.
This makes sense if the crust is in balance on top of the mantle. The crust effectively floats on the denser mantle beneath it. If the surface is at the same elevation everywhere, the weight of the column of rock below should balance out from place to place. Where the basin holds 10 kilometres of light sediment, the crust beneath it must be thinner, with the heavy mantle reaching closer to the surface to make up the difference. Assuming this balance, known as isostatic equilibrium, the team estimates that the Moho beneath the basin is uplifted by as much as 45 percent compared with the surrounding crust.
In other words, under downtown Los Angeles there are 10 kilometres of soft sediment on top, and beneath them the hard crust is the thinnest in the region. A survey that set out to measure the depth of the basin came back with a map of crustal thickness as well. The team notes that the extent of this thinning is also a clue for reconstructing how the basin formed.

Not a Shaking Map, but a Map for Calculating Shaking
To be clear, this map does not directly show where the shaking will be strongest. Actual ground motion depends on many things: which fault ruptures, which direction the waves arrive from, what the shallow soil is like. Villa herself describes the map as something that lets researchers update their simulations and test different scenarios. The shape of the basin is the foundation on which shaking is calculated.
Even so, that foundation is one of the biggest factors deciding how the shaking is distributed. Clayton says that when a large earthquake hits Los Angeles, some city blocks will be badly damaged and others relatively unscathed, and the variations in the basin beneath them control which is which. Deeper sediment produces slower, longer-period shaking, the equivalent of a low musical note, which affects large buildings such as high-rises. Shallow sediment favours shorter-period shaking, more like a high note, and lower buildings are generally thought to be more sensitive to that. Cochran explains that damage gets worse when a building’s natural sway falls into “resonance” with the shaking of the ground beneath it, and that if the underground structure is known, engineers can avoid this by, for example, changing a building’s stiffness.
The team’s next target is the nature of the sediment-bedrock boundary itself. A hard basin floor bounces waves arriving from below back up to the surface, and knowing how wave speed changes at that boundary will make strong-motion simulations more complete. Beyond that lies the top kilometre of soil. According to Clayton, the soil can vary greatly from block to block, and that feeds directly into how houses and buildings shake. Denser observations are needed, he says, and community reports of felt shaking, such as the USGS “Did You Feel It?” system, may be one way to get them.
One last point. When people think of Los Angeles earthquakes, the San Andreas Fault to the east gets the attention, but Clayton stresses that an earthquake inside the basin could be just as destructive. The 1933 Long Beach earthquake was a magnitude 6.4 event on the Newport-Inglewood Fault, which runs through the basin. Soft ground combined with the weak construction of the time to cause heavy damage. Knowing the shape of the basin matters for both kinds of earthquake.
Related products
You can find books and products related to this article on Amazon.
If you buy through the links above, this blog may earn a commission.
Sources
- Villa, V. & Clayton, R. W. (2026) Three-Dimensional Structure of the Los Angeles Basin and Its Underlying Moho. Journal of Geophysical Research: Solid Earth, 131(8). https://doi.org/10.1029/2026JB033837
- Caltech, “New Underground Map of the Los Angeles Region Tracks Seismic Shaking” (31 August 2026): press release
- Villa, V., Clayton, R. W., Lin, F. & Ford, H. A. (2024) The Los Angeles Basin Shape and its Underlying Shallow Moho. Poster, 2024 SCEC Annual Meeting: abstract
- Live Science, “We now have an incredibly detailed map to help predict which areas of LA are the most at risk from ‘The Big One'” (14 September 2026, Stephanie Pappas): article


コメント