This article contains affiliate links. As an Amazon Associate I earn from qualifying purchases.
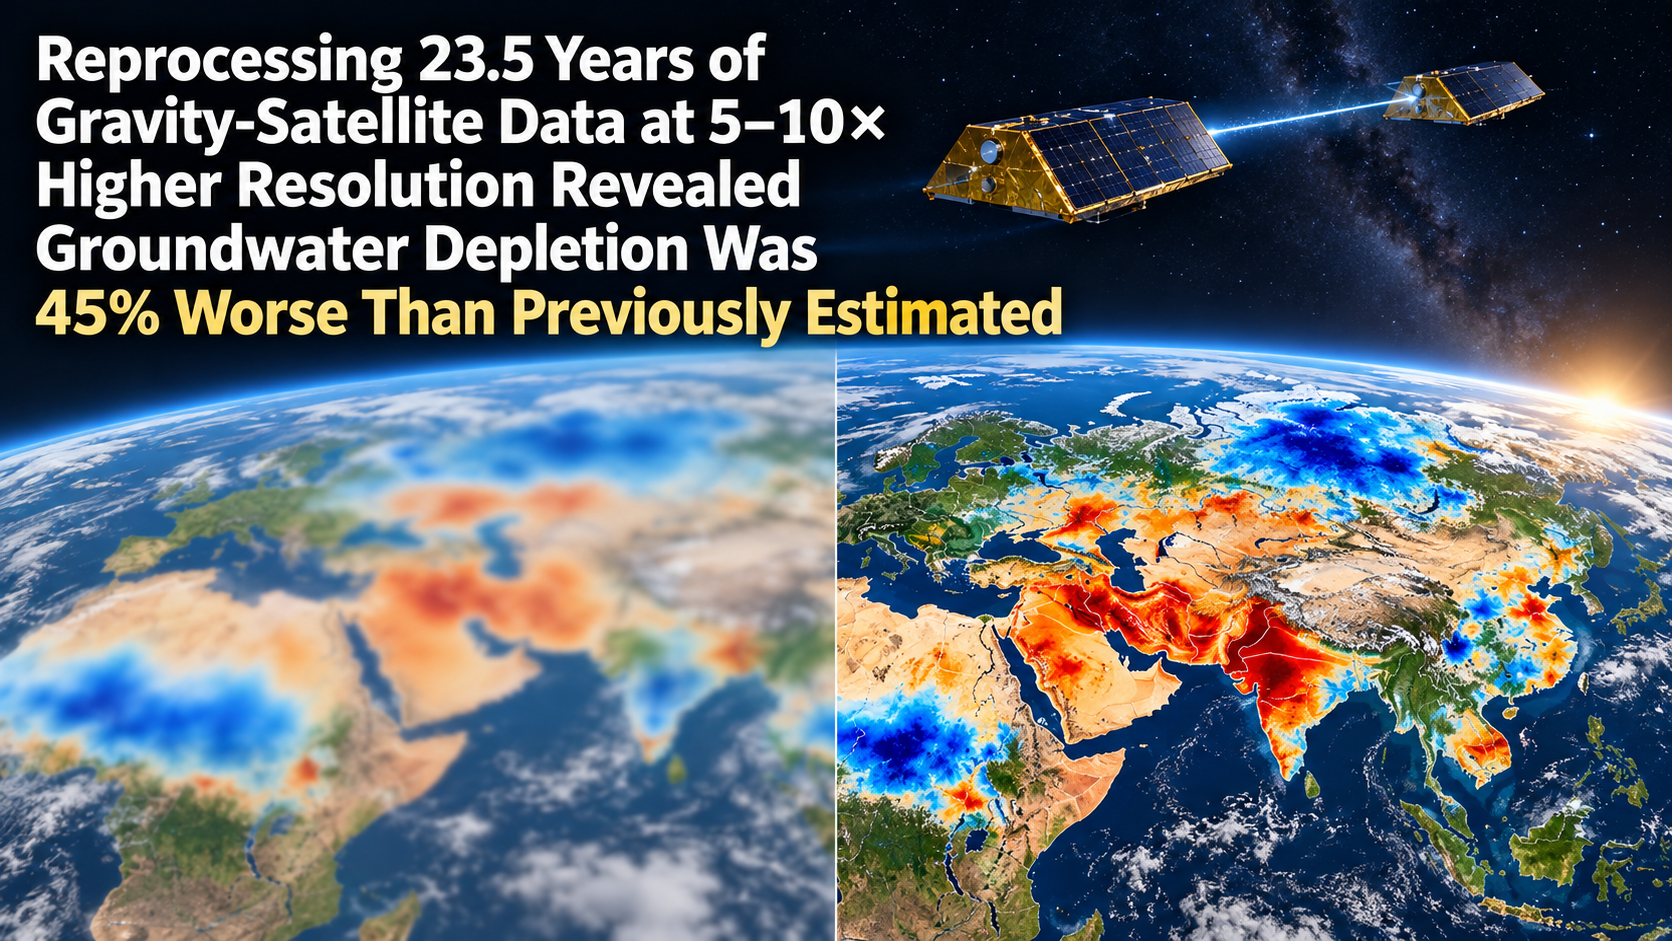
Where on Earth is water being lost, and where is it piling up? A pair of satellites has been measuring this from orbit for more than two decades: NASA’s GRACE mission and its successor, GRACE Follow-On. Two spacecraft fly the same orbit roughly 200 km apart and continuously measure the distance between them to within micrometres. When a large concentration of mass lies ahead, the leading satellite is pulled forward first and the gap opens slightly; once they pass over it, the gap closes again. From these tiny stretches and squeezes, scientists reconstruct Earth’s gravity field month by month. Of everything that reshuffles that field over months to years, the largest mover is water. Track the gravity changes and you can track the gains and losses of all the water stored on land: groundwater, lakes, soil moisture, snow and ice.
GRACE launched in 2002 and GRACE-FO took over in 2018. Over those twenty-odd years, the mission showed that groundwater in northern India is steadily being pumped away for agriculture and that the dry regions of the Middle East and North Africa are losing water. The map, however, had a weakness: it was blurry. The smallest feature that standard processing can resolve is about 150,000 square kilometres, roughly the size of Bangladesh. You could say “somewhere in this country, water is being lost”, but not “in this aquifer, this reservoir, or this irrigation district”.
Mary Michael O’Neill, Matthew Rodell and Bryant D. Loomis of NASA’s Goddard Space Flight Center have now applied a processing method that sharpens that map five- to tenfold across the whole globe, and redrawn the trends in land water from April 2002 to November 2025, 23 and a half years in all. Their paper appeared in PNAS on 14 September 2026. The redrawn map shows that the water losses already known were steeper than anyone had estimated, and it reveals a set of places where water has been accumulating that no one had ever seen in gravity data before.
A new approach that solves 23 years of raw data in one go
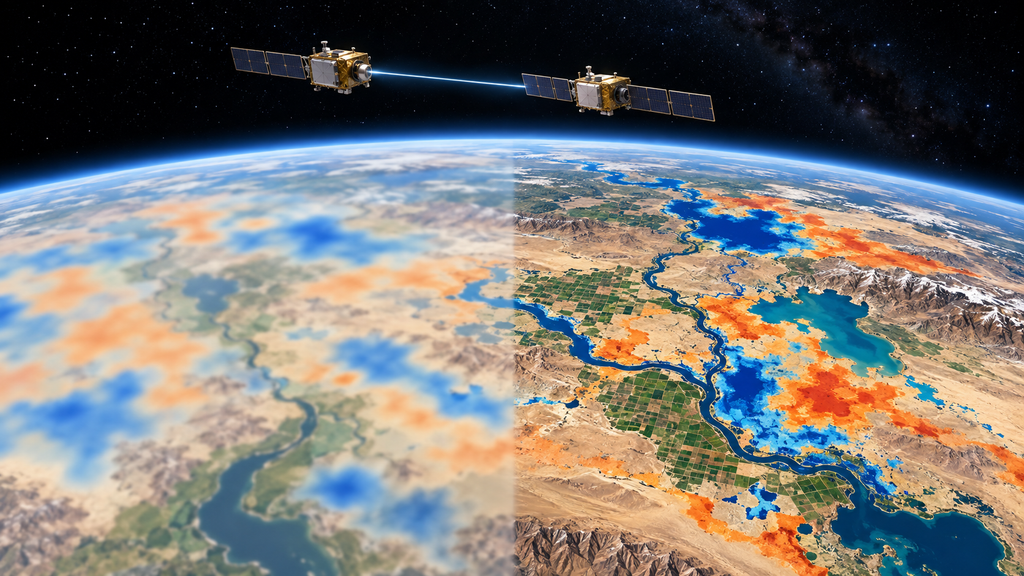
The conventional approach first turns the satellite ranging data into a gravity map for each month, then lines up those monthly maps to fit a long-term slope, or trend, at every location. Making each monthly map requires spatial smoothing to suppress noise, and that smoothing flattens fine detail. Stacking any number of flattened maps will not bring the detail back.
The new method reverses the order. Instead of building monthly maps, it takes the raw record of changes in the distance between the two satellites (data at the processing stage known as Level-1B), “stacks” all 23 and a half years of it, and solves directly for the long-term trend at each location in a single regression. Because the full span of information is used at once, small signals that would drown in noise on a monthly basis survive. The technique itself has recently been used to measure ice loss from Greenland and Antarctica, where it was shown to improve agreement with altimetry. This paper is the first to apply it to a global map of water on land.
Resolution is compared in terms of the blur radius, that is, how far a single point spreads out on the map. Trends fitted from conventional monthly maps have a radius of 235 to 350 km; the new method brings it down to 100 to 110 km. In terms of area that is a five- to tenfold improvement, and the smallest feature resolvable at mid-latitudes shrinks from more than 120,000 square kilometres to about 12,000.
Something is given up in exchange. Collapsing 23 and a half years into a single slope erases year-to-year variability, such as a particular drought or flood. This is a method for extracting the long-term trend and nothing else.
Forty regions attributed to human activity
On the finished map, the areas where water had increased or decreased significantly, beyond the noise and beyond the uncertainty in crustal rebound, covered 22% of the land surface and clustered into 94 regions. Losses summed to 404 gigatonnes (Gt) per year, gains to 176 Gt per year. One gigatonne is a billion tonnes, or almost exactly one cubic kilometre of water.
The next step was to sort out statistically whether each change was driven by climate or by people. On the climate side, the explanatory variables were precipitation and its trend, atmospheric dryness (vapour pressure deficit) and glacier mass change since 2000. On the human side: the share of land irrigated with groundwater, the share irrigated with surface water from rivers and lakes, the share of rain-fed cropland, the share of land deforested since 1960, and the capacity of reservoirs built in the 21st century. Neighbouring points on a satellite map tend to have similar values, so an ordinary regression would overstate the strength of every relationship. The team therefore built spatial autoregressive models, which account for that spatial correlation, for each continent.
On every non-polar continent except Australia, at least one of the human variables had a significant effect on the spatial pattern of water change. In North America, the Middle East and North Africa, northern Asia and South America, the single strongest variable was a human one. Combining the local statistics with the published literature, the team classified 40 of the 94 regions as driven mainly by human land or water use. They range in size from 74,000 to more than 1.5 million square kilometres. In 22 of them water increased; in 18 it decreased. Over the 23 and a half years, the 40 regions lost a cumulative 3,122 Gt and gained 2,432 Gt. The loss exceeds the entire volume of Lake Victoria.
Groundwater depletion, re-estimated
The first finding is that the groundwater losses already known were steeper than thought. Across the 40 regions, trends fitted from conventional monthly maps underestimated the new map’s trends by 33% on average. For the seven regions smaller than 100,000 square kilometres, the underestimate widens to 52%: the smaller the region, the more the blur had been hiding. Going further, previously published estimates of depletion caused by groundwater pumping were on average 45% lower than the new values, even after accounting for differences in area and time span.
Northern India is where GRACE first detected severe agricultural groundwater depletion. The new estimate is a loss of 32.4 Gt per year (27.5 Gt once the shrinking Himalayan glaciers are subtracted), well above the 15 to 18 Gt reported by other recent studies. Rainfall during the observation period was above average, but not enough to offset the pumping. Glacier retreat accounts for only about 15% of the change.
In the Middle East and North Africa, 42 Gt per year was being lost from an area of less than 2.5 million square kilometres. A previous study had reported a similar figure from 7 million square kilometres, which means the loss is concentrated in a far smaller footprint. A single region in central Saudi Arabia is losing 12.7 Gt per year, more than six times the country’s annual renewable water supply. One region in Turkey is losing 8.6 Gt per year, more than double a recent estimate. In Iran, the Salt Lake basin, which supplies water to over a quarter of the country’s population, is losing 6.8 Gt per year, and the Central Desert to its northeast 5.3 Gt per year. Those two regions make up about a quarter of Iran’s area, yet their combined 12.1 Gt per year is almost the same as a figure an earlier study had reported for the whole country. In the North-Western Sahara Aquifer System shared by Algeria, Tunisia and Libya, earlier work had put the loss at 3.0 to 3.7 Gt per year from a million square kilometres; the new map finds 4.5 Gt per year disappearing from just 310,000.
The same holds in the Americas. The south-western United States is losing 6.8 Gt per year, centred on California’s Central Valley, and the southern High Plains from Colorado to Texas 5.9 Gt per year, in a region where more than 80% of irrigated land depends on groundwater. The Mexican state of Chihuahua is losing 3.8 Gt per year even though less than 5% of its land is officially classed as irrigated, which had kept it off most researchers’ radar. The blurry map had simply missed it.
Water gains that gravity had never shown before
The second finding is the most interesting part of the paper. In 22 of the 40 regions, a majority, water was increasing, and many of those gains could not even be confirmed to exist at the old resolution.
Reservoirs are the straightforward case. During the GRACE era, 450 large reservoirs were filled worldwide, adding 746 Gt to a global reservoir capacity now exceeding 6,800 Gt. The Boguchany Reservoir on Siberia’s Angara River, filled between 2012 and 2015, was the largest reservoir built this century until Ethiopia’s Grand Ethiopian Renaissance Dam (GERD), yet it has received almost no attention in the research literature. On the new map it shows up as a gain of 3.8 Gt per year, about 90 Gt in total, close to its reported capacity of 58.2 Gt. It is the strongest signal anywhere in non-polar northern Asia. The GERD reservoir (74 Gt capacity, filled between 2020 and 2025) likewise fully explains a gain of 3.2 Gt per year around it. Malaysia’s Bakun Reservoir has a surface area of only about 700 square kilometres, making it one of the smallest features GRACE has ever measured on its own.
Farmland is the surprise. In the equatorial grasslands of Africa, savanna has been converted to fields of millet and other crops. In the broad region known as the West Sudanian Savanna, native grassland and shrubland have shrunk by 14% since 1960 and rain-fed cropland now covers 17% of the land, and here total water storage rose by 28.7 Gt per year, despite below-average rainfall during the observation period. In Senegal and the Gambia, and in southern Ghana, annual precipitation has fallen significantly over the past four decades, yet water storage has gone up.
The team’s explanation runs as follows. Crops such as millet and legumes have shallower roots than the native vegetation and return less water to the atmosphere through transpiration. When rain falls, a larger share bypasses the plants and seeps into shallow groundwater. Traditional soil and water conservation practices in Burkina Faso and Niger, such as zaï pits dug to capture rainwater, half-moon earthworks and stone bunds, also cut runoff and direct water underground. It had been suggested before that twentieth-century land clearing in the Sahel raised the water table, but the authors write that this is the first time gravity observations have shown it clearly. South America shows the same pattern: in Brazil’s Maranhão state, a region that lost 15% of its forest gained 3.7 Gt of water per year, and around Lake Tanganyika a region that lost 14% of its forest gained 12.3 Gt per year, with deforested area and water gain going hand in hand. The team cautions, though, that a local gain can reduce the water available downstream or in the surrounding region.
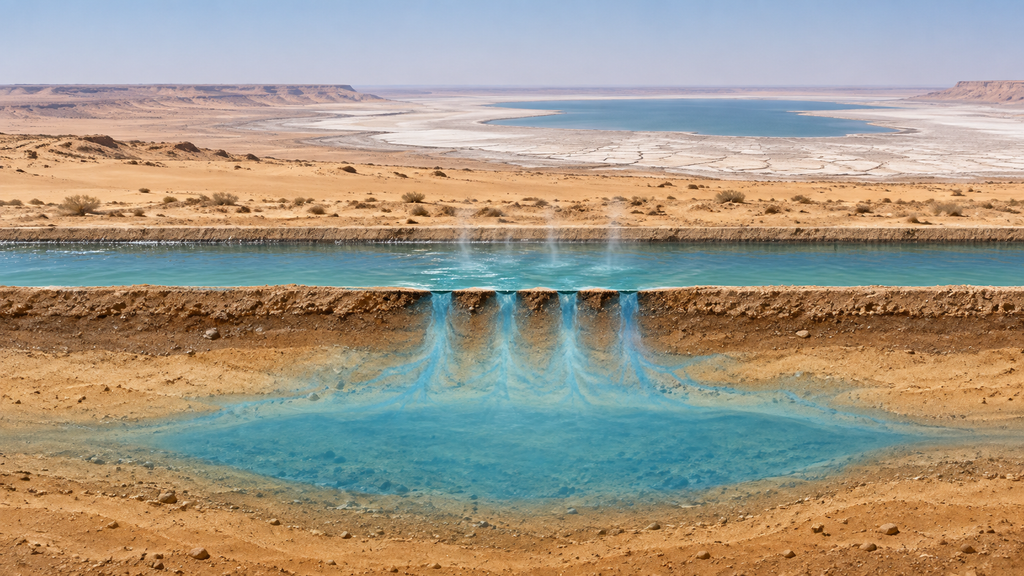
And then there is a canal in the desert. Central Asia’s Aral Sea has shrunk by 74% from its mid-twentieth-century area of 66,000 square kilometres because the rivers that fed it were diverted for agriculture, and the new map shows it still losing 4.9 Gt per year. To its south, in the middle of the Karakum Desert, is a place gaining 1.2 Gt of water per year. Rainfall there is below average and declining, so climate cannot explain it. The gain was concentrated along a 720-km canal built to collect irrigation drainage and carry it to the Karashor Depression. Much of that water arrives via the Karakum Canal, the second-longest canal in the world, which diverts the Amu Darya River to support farming in the desert to the west. The canal is mostly unlined and flood irrigation dominates, so 50 to 55% of the diverted water evaporates or soaks into the ground before it ever reaches a field. That leaked water has been accumulating beneath the desert sand, and it has become a gravity signal visible from space. By the team’s calculation, the gain amounts to about a quarter of what the Aral Sea is losing.
What this map cannot say
Sharper tools come with clearer limits. First, GRACE measures the rate at which water storage is changing, not how much water remains in an aquifer. The data therefore cannot answer “how many years until it runs dry”, a point lead author O’Neill also made when speaking to Live Science.
The attribution has caveats too. Precipitation and atmospheric dryness are strongly correlated with each other, and the statistical model alone cannot fully separate how much each contributed. Groundwater irrigation and surface-water irrigation tend to overlap on the same land, so their independent contributions are not fully disentangled either. And “non-local” human activities that move water regardless of local land use, such as upstream dams, river diversions and connections between distant aquifers, cannot be captured by this statistical approach. For the Aral Sea, the Karakum Desert and the pumping fields of Libya’s Great Man-Made River project, the team assigned causes through direct examination of the literature rather than statistics.
Even so, the authors write that being able to draw long-term trends in this much detail from gravity alone, without auxiliary data or downscaling tricks, matters a great deal for tracking water in poorly monitored regions. GRACE-FO’s successor, GRACE-C, is scheduled to launch in 2028, and the European Space Agency plans a next-generation gravity mission a few years after that. As the observational record lengthens, the method’s resolution is expected to improve further.
Related products
You can find books and products related to this article on Amazon.
If you buy through the links above, this blog may earn a commission.
Sources
- O’Neill, M. M., Rodell, M. & Loomis, B. D. (2026). Spatially refined satellite gravimetry captures human signatures in global terrestrial water storage trends. PNAS, 123(38). https://doi.org/10.1073/pnas.2600775123
- Author’s accepted manuscript (NASA Technical Reports Server, free to read): https://ntrs.nasa.gov/citations/20260008519
- Live Science (23 September 2026, Sascha Pare): ‘It has become very dire in a lot of places’: New map reveals exactly where humans are adding and removing precious fresh water on Earth

コメント