
This article contains affiliate links. As an Amazon Associate I earn from qualifying purchases.
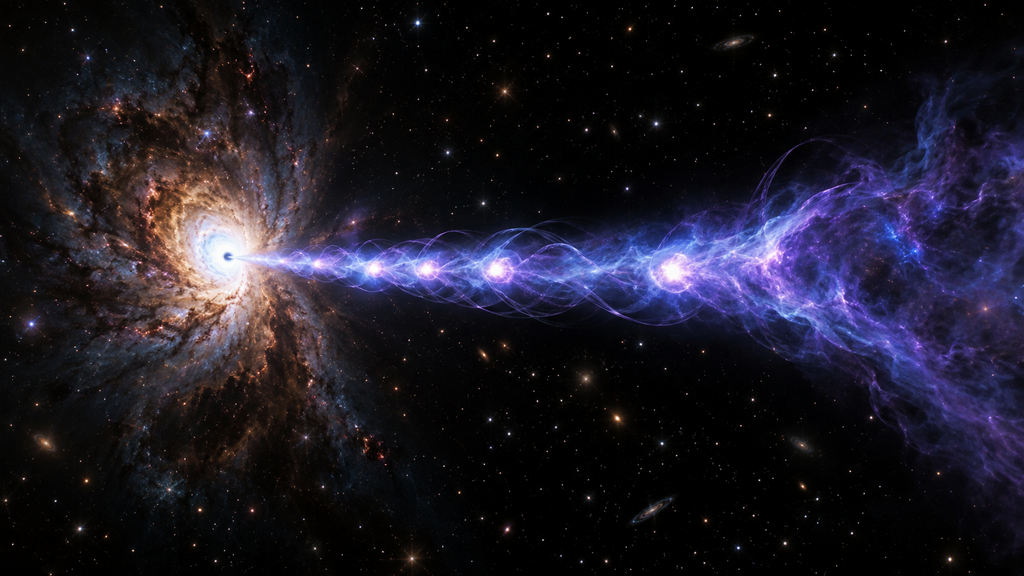
About 5.5 billion light-years away, in the direction of Hercules, sits a quasar called 3C 345. A jet of plasma launched by the supermassive black hole at its center points almost straight at Earth, which makes it a blazar. In radio images, bright blobs stream down the jet at apparent speeds of more than ten times the speed of light. Nothing is really moving faster than light. The effect appears when something travelling at nearly light speed comes almost directly toward you and you watch it from a slight angle.
For about forty years, those bright blobs have been explained as shock waves travelling down the jet. A paper published in Nature on 26 August 2026 reassembled 27 years of observations into a single continuous video and reported that, at least for 3C 345, the explanation does not hold. When the team measured the speed of the blobs, it was almost the same as the speed of the plasma around them.
A Jet Followed in Still Images, One Every Three Months
Jets are observed with very long baseline interferometry (VLBI). Several radio telescopes far apart receive the same source at the same time, and their signals are combined so that they act as one enormous dish as wide as the distance between them. The Event Horizon Telescope, which took the first picture of a black hole’s shadow, works the same way.
The raw material here came from the Very Long Baseline Array (VLBA) in the United States, ten antennas spread from Hawaii to the Virgin Islands. A program called MOJAVE has used the array to image hundreds of jets at 15 GHz on a regular schedule. 3C 345 was observed 116 times between 1995 and 2022, roughly once every three months on average, though the spacing is uneven and there are gaps.
The usual approach turns each observation into one still image. The bright blobs in it are approximated with smooth bumps (Gaussian functions), and their positions are compared from one epoch to the next to measure how far they moved. That gives the speed of the blobs, but not the speed of the thin plasma flowing around them. The 116 stills were a record of the jet, but what happened in between remained unknown.
Solving All 116 Epochs as One Video
Marianna Foschi and colleagues at the California Institute of Technology built an image reconstruction method called kine. Instead of processing the 116 observations one at a time, it feeds all of them into a single neural network and trains it to represent a function that answers one question: at this position on the sky, at this moment, how bright is the source and how is it polarized? The only inputs are right ascension, declination and time. The outputs are brightness and polarization. From the network’s video, the method calculates what the array should have recorded and adjusts the network until the difference from the real data is small.
The advantage is that the image for any one date automatically draws on the observations before and after it. The jet changes little in three months, so neighbouring epochs tell the network where structure ought to be. Networks of this kind also learn large, smooth features before fine noise, which acts as an automatic control on how smooth the result should be. There is almost nothing for a person to tune by hand. Fitting all 116 epochs took about 1.3 hours on four GPUs.
The resulting video has an effective resolution of about 113 microarcseconds, roughly four times finer than the nominal limit of 475 microarcseconds set by the array’s size, and its dynamic range, the contrast between the brightest and faintest parts, is about 140 times that of the conventional method. The authors stress that these gains rest on the quantity and quality of this particular dataset, and the same factors should not be expected for every dataset.
The other key property is that the video is continuous in time. The trained network can return an image for a date on which no observation was made, so the team could resample the video at even intervals. In tests on synthetic data, interpolation preserved motion for frames up to six months away from the nearest observation. In the actual analysis, the farthest interpolated frame was 5.7 months from a real one. These in-between frames are the model’s estimates, not photographs recovered from an archive.
The Flow and the Blobs Were Moving at the Same Speed
A continuous, smooth video opens the door to standard video-processing tools. The team used optical flow, which tracks pixel by pixel where the pattern of brightness moves between frames, to build a map of velocity across the jet. On the assumption that changes in brightness trace the motion of the plasma, this gives the speed at any point in the jet, not only at the blobs but in the flow around them.
The apparent speed is highest on the southern side, 1 to 3 milliarcseconds from the core, averaging 12 times the speed of light. It drops to 9 to 11 times light speed farther out and to 5 to 8 times in the diffuse outer region. Corrected for the reported tilt of the jet, 3 to 6.8 degrees from the line of sight, the fastest physical speed is 99.7 percent of the speed of light. The spread in speed is 3 to 6 times light speed everywhere, which indicates a turbulent flow.
Then came the result mentioned at the start. The bright blobs move at apparent speeds of 10 to 13 times light speed, while the average for the surrounding plasma in the same regions is 9 to 12 times. The two ranges overlap. If the blobs were shocks, the speed of the shock itself (the pattern speed) and the speed of the compressed plasma flowing behind it should differ clearly. In 3C 345, that difference was not there.
The team checked a second clue: polarization. A shock compresses the plasma, which aligns the magnetic field along the shock front and should raise the fraction of polarized light at that spot. The polarization pattern of 3C 345 points to a magnetic field wound around the jet like rings (a toroidal field), and with that kind of field, a shock would show up as a local rise in polarization fraction. Yet the places where the polarization fraction peaks showed no correspondence to the positions of the bright blobs.
Same speed as the flow, and no trace of a shock in the polarization. From these two findings, the paper interprets the bright blobs in 3C 345 not as strong shocks but as regions where the magnetic field has locally strengthened and the emission has brightened. In the turbulent plasma, magnetic pressure rises in patches, and those patches glow. When they are ejected toward the south, their motion toward us makes them look brighter still through Doppler boosting.
A Conclusion That So Far Covers One Source
Foschi told Space.com that finding the blobs moving at almost the same speed as the bulk flow was a surprise. She also said that because the team analysed only one blazar, the result does not question the shock interpretation in general, only in the specific case of 3C 345. The paper itself notes that if the protons in the jet are not highly relativistic, a shock’s pattern speed and the flow speed can also come out similar.
Even so, the method matters. Earlier analyses could measure only the speed of the blobs, so the comparison between blob and flow could not be made at all. Because kine turns a large number of observations into a video in a short time, the same test can be applied directly to the hundreds of sources with decades of records in programs like MOJAVE. The team plans to apply it to other blazars next. Whether this leads to a revision of the shock model or shows 3C 345 to be an exception will be decided there.
kine was originally developed for the Event Horizon Telescope’s observations of Sagittarius A*, the black hole at the center of the Milky Way. That source changes within a single night of observing, which makes even one still image hard to solve for. This time the same tool was pointed at the opposite kind of target, one that changes slowly over 27 years. The co-authors include Katherine Bouman, known for the first image of a black hole, and researchers at the Instituto de Astrofísica de Andalucía in Spain and the University of Toronto.
One note: this article was written with the AI assistant Claude. The research described here applies a neural network to astronomical image reconstruction and touches on what AI can do, so please keep that in mind.
Related products
You can find books and products related to this article on Amazon.
If you buy through the links above, this blog may earn a commission.
Sources
- Foschi, M. et al. (2026) “Video reconstruction of variable VLBI observations with neural fields” Nature 657, 900–905. https://doi.org/10.1038/s41586-026-10988-5 (open access)
- Space.com, “Scientists track 27 years of a supermassive black hole blasting plasma at our planet” (21 September 2026, Robert Lea) https://www.space.com/astronomy/black-holes/scientists-track-27-years-of-a-supermassive-black-hole-blasting-plasma-at-our-planet
- Live Science, “See the highest-resolution footage of a black hole jet ever taken, thanks to AI and 27 years of observations” (9 September 2026, Elizabeth Howell) https://www.livescience.com/space/astronomy/see-the-highest-resolution-images-of-a-black-hole-jet-ever-taken-thanks-to-ai-and-27-years-of-observations


コメント